20:00
Linear Regression IV
Grayson White
Stat 243
Week 3 | Fall 2026
Goals for today (and next week)
Today:
- Quiz
- Linear regression extensions
- Release Lab 2
Next week:
- Resampling methods
Quiz
Linear Regression
Model Form:
\[ \begin{align} y &= \beta_o + \beta_1 x_1 + \beta_2 x_2 + \cdots + \beta_p x_p + \epsilon \end{align} \]
Linear regression is a flexible class of models that allow for:
Both quantitative and categorical explanatory variables.
Multiple explanatory variables.
Curved relationships between the response variable and the explanatory variable.
BUT the response variable is quantitative.
More time with the palmerpenguins!
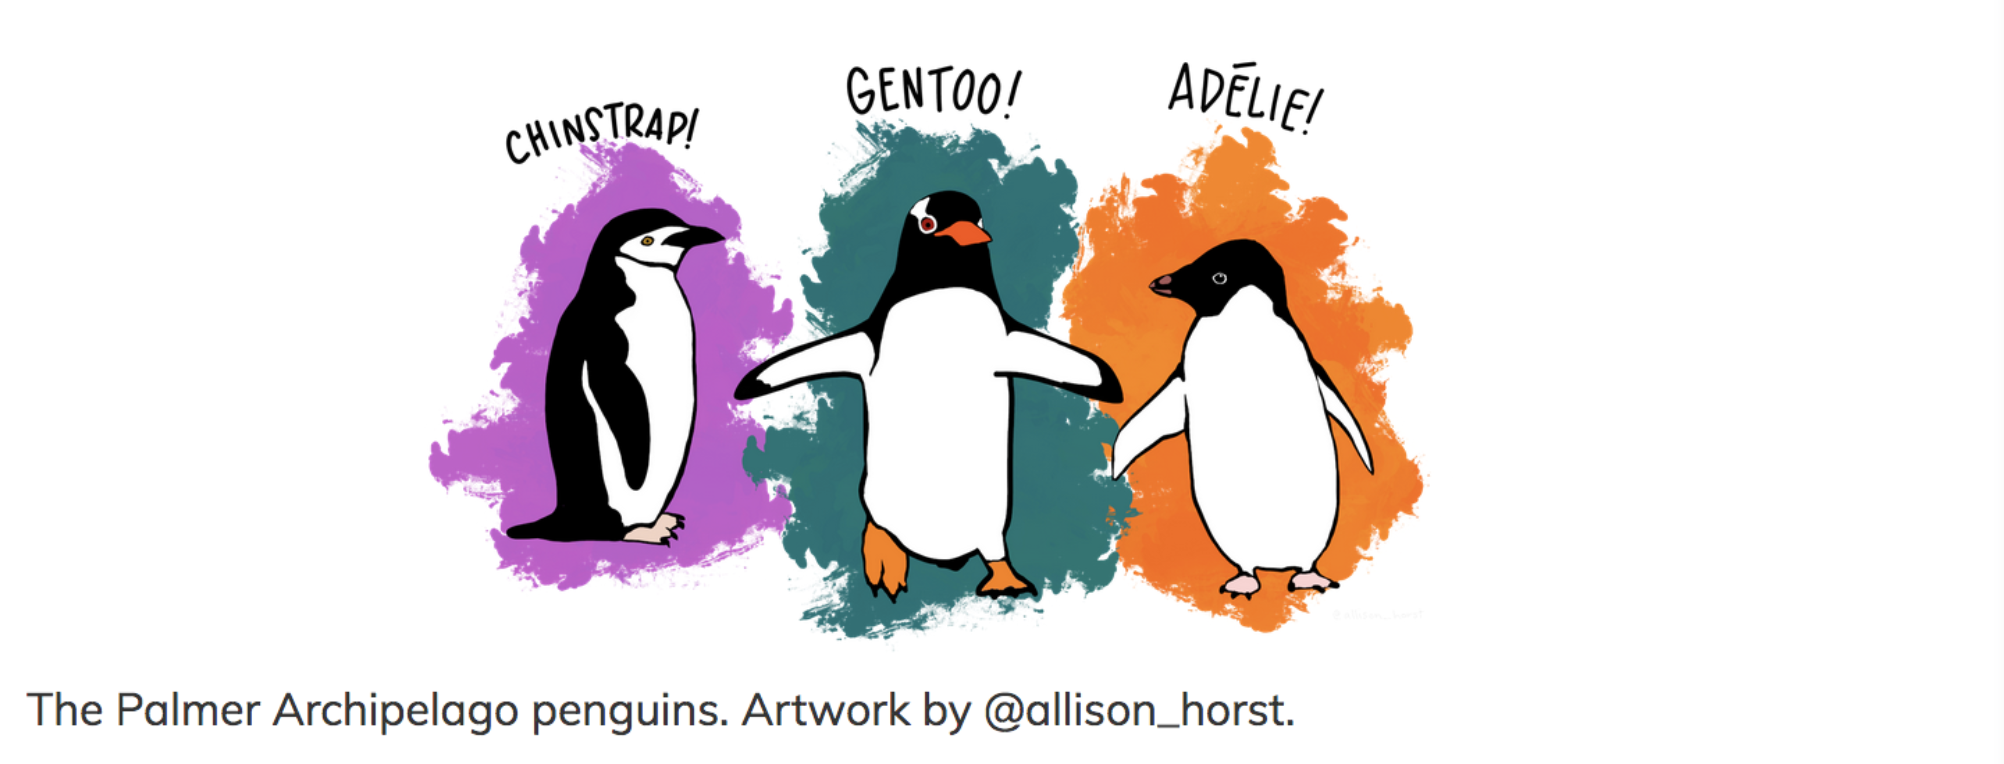
Recap: Regression with the penguins so far
One Quantitative Variable
# A tibble: 2 × 7
  term          estimate std_error statistic p_value lower_ci upper_ci
  <chr>            <dbl>     <dbl>     <dbl>   <dbl>    <dbl>    <dbl>
1 intercept        55.1      2.52      21.9        0   50.1     60.0
2 bill_depth_mm    -0.65     0.146     -4.46       0   -0.936   -0.363
Recap: Regression with the penguins so far
One Categorical Variable
# A tibble: 3 × 7
  term               estimate std_error statistic p_value lower_ci upper_ci
  <chr>                 <dbl>     <dbl>     <dbl>   <dbl>    <dbl>    <dbl>
1 intercept             38.8      0.241     161.        0    38.3     39.3
2 species: Chinstrap    10.0      0.432      23.2       0     9.19    10.9
3 species: Gentoo 8.71 0.36 24.2 0 8.01 9.42- Estimated regression line for \(x_2 = 1\):
- Estimated regression line for \(x_2 = 0\):
Recap: Regression with the penguins so far
Equal Slopes Model
# A tibble: 4 × 7
  term               estimate std_error statistic p_value lower_ci upper_ci
  <chr>                 <dbl>     <dbl>     <dbl>   <dbl>    <dbl>    <dbl>
1 intercept             13.2      2.25       5.88       0     8.80    17.6
2 species: Chinstrap     9.94     0.368     27.0        0     9.22    10.7
3 species: Gentoo       13.4      0.512     26.2        0    12.4     14.4
4 bill_depth_mm 1.39 0.122 11.4 0 1.15 1.63- Estimated regression line for \(x_2 = 1\):
- Estimated regression line for \(x_2 = 0\):
Recap: Regression with the penguins so far
Different Slopes Model
# A tibble: 6 × 7
  term                    estimate std_error statistic p_value lower_ci upper_ci
  <chr>                      <dbl>     <dbl>     <dbl>   <dbl>    <dbl>    <dbl>
1 intercept                 23.1       3.02       7.65   0       17.1      29.0
2 species: Chinstrap        -9.64      5.72      -1.69   0.093  -20.9       1.60
3 species: Gentoo           -5.84      4.54      -1.29   0.199  -14.8       3.08
4 bill_depth_mm              0.857     0.164      5.22   0        0.534     1.18
5 species: Chinstrap:bil…    1.06      0.31       3.44   0.001    0.455     1.68
6 species: Gentoo:bill_d… 1.16 0.279 4.17 0 0.615 1.71- Estimated regression line for \(x_2 = 1\):
- Estimated regression line for \(x_2 = 0\):
This time: Regression with multiple quantitative predictors
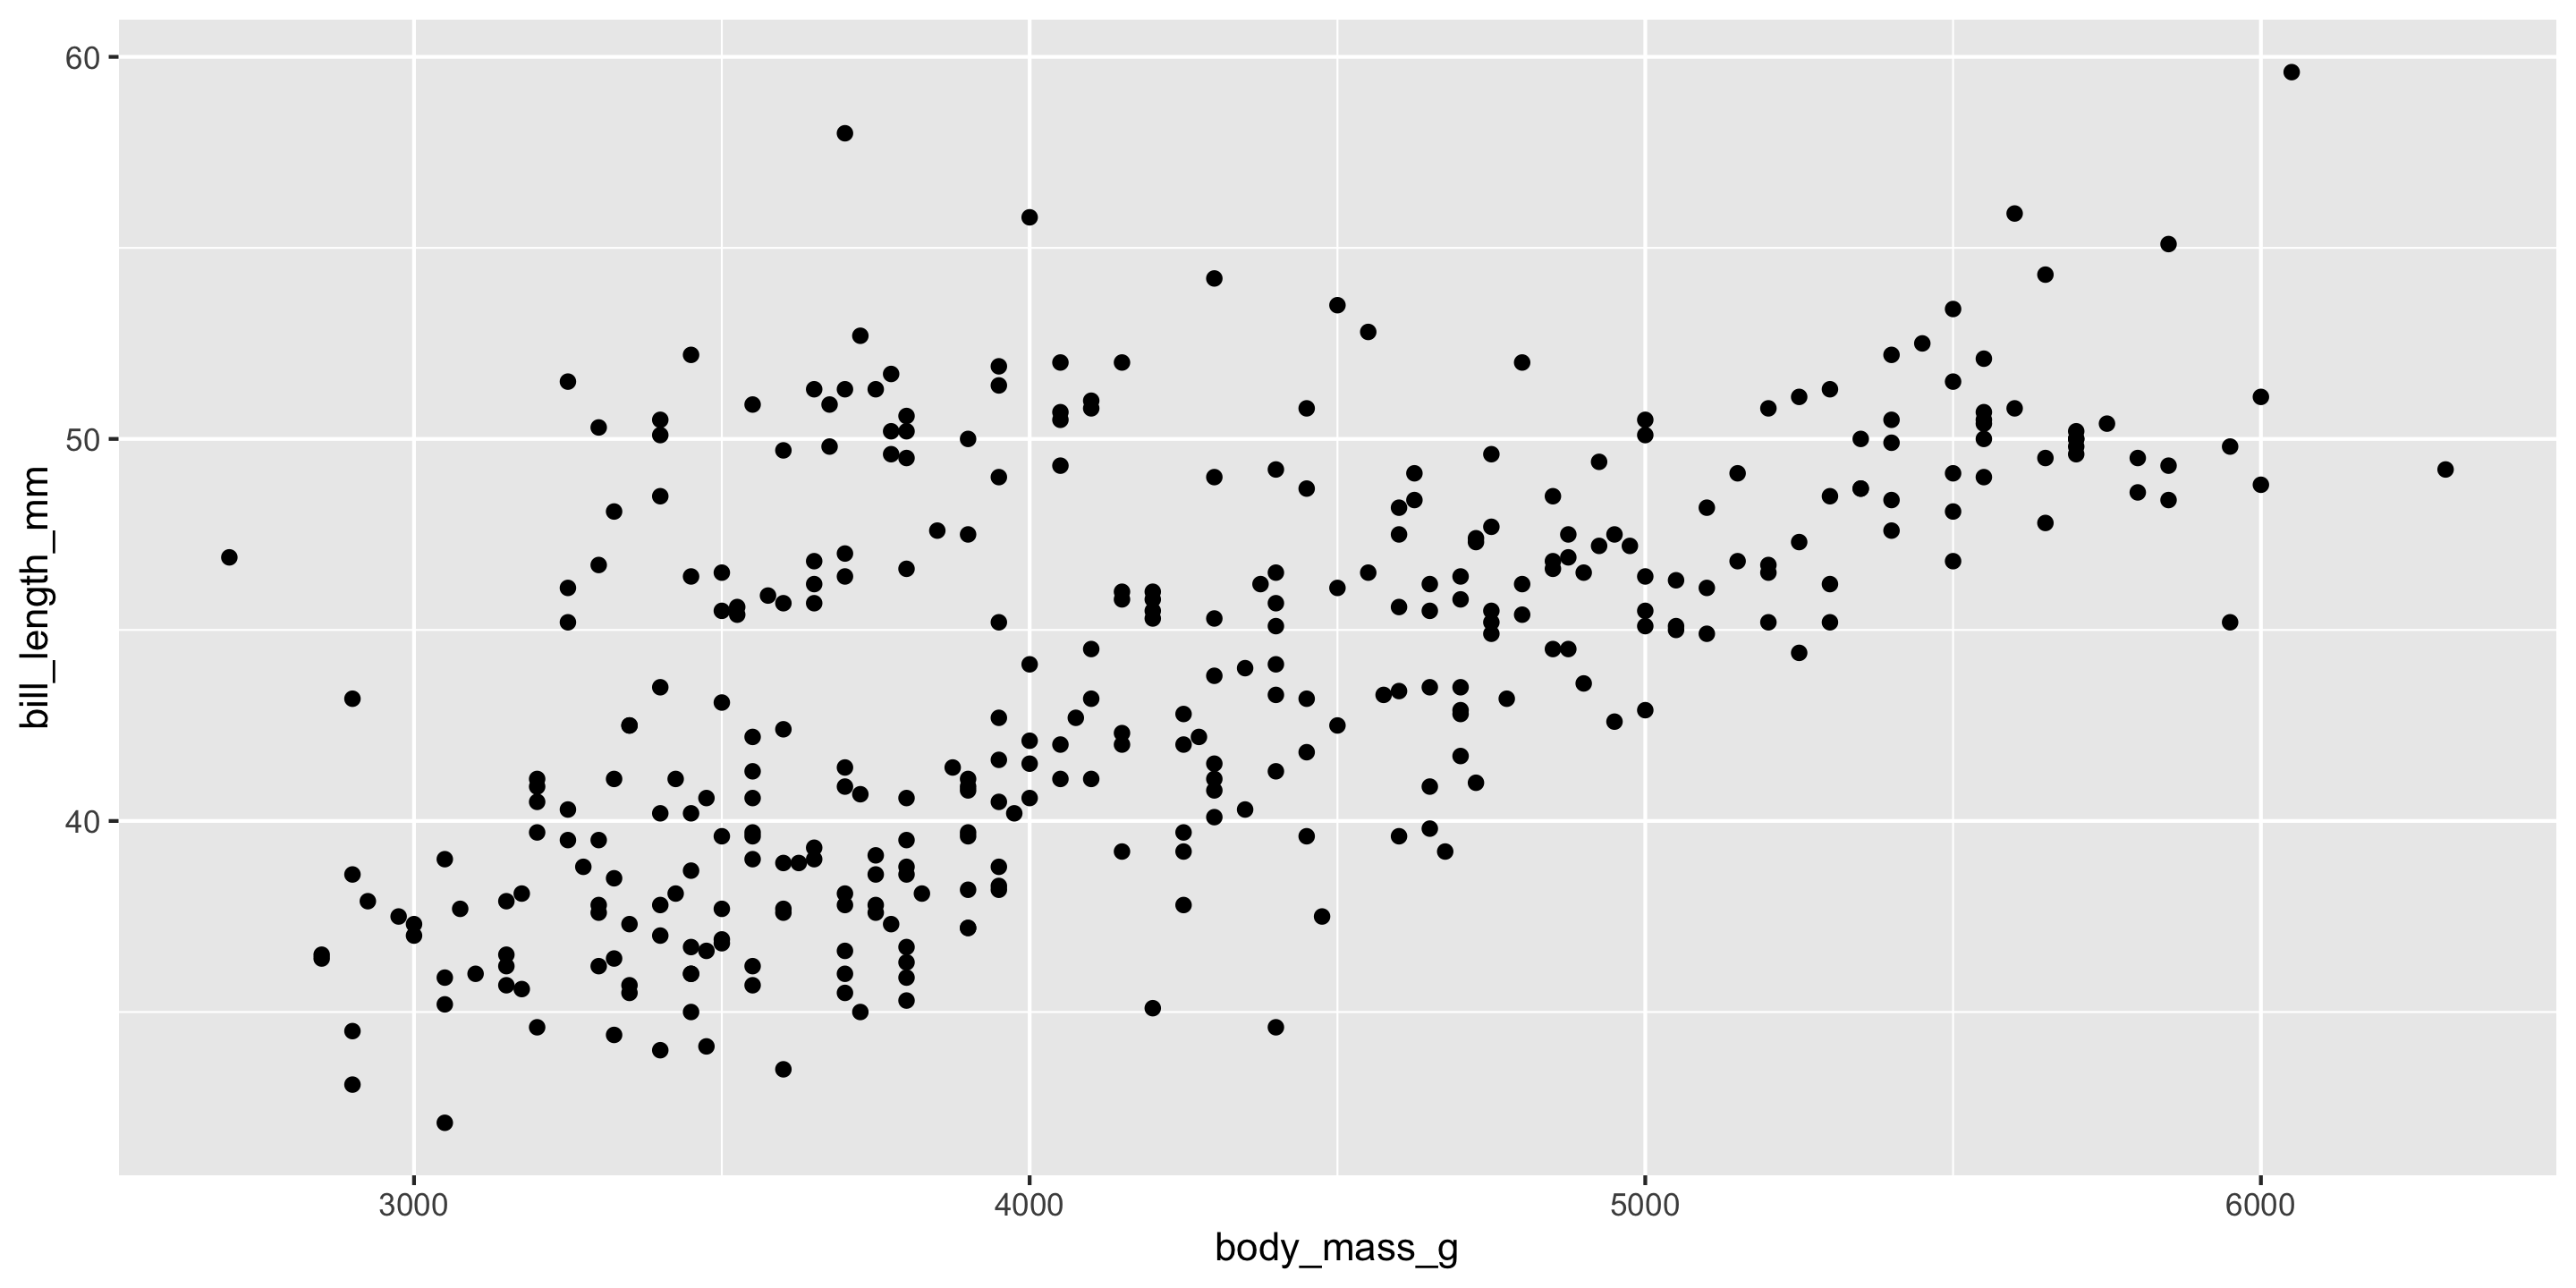
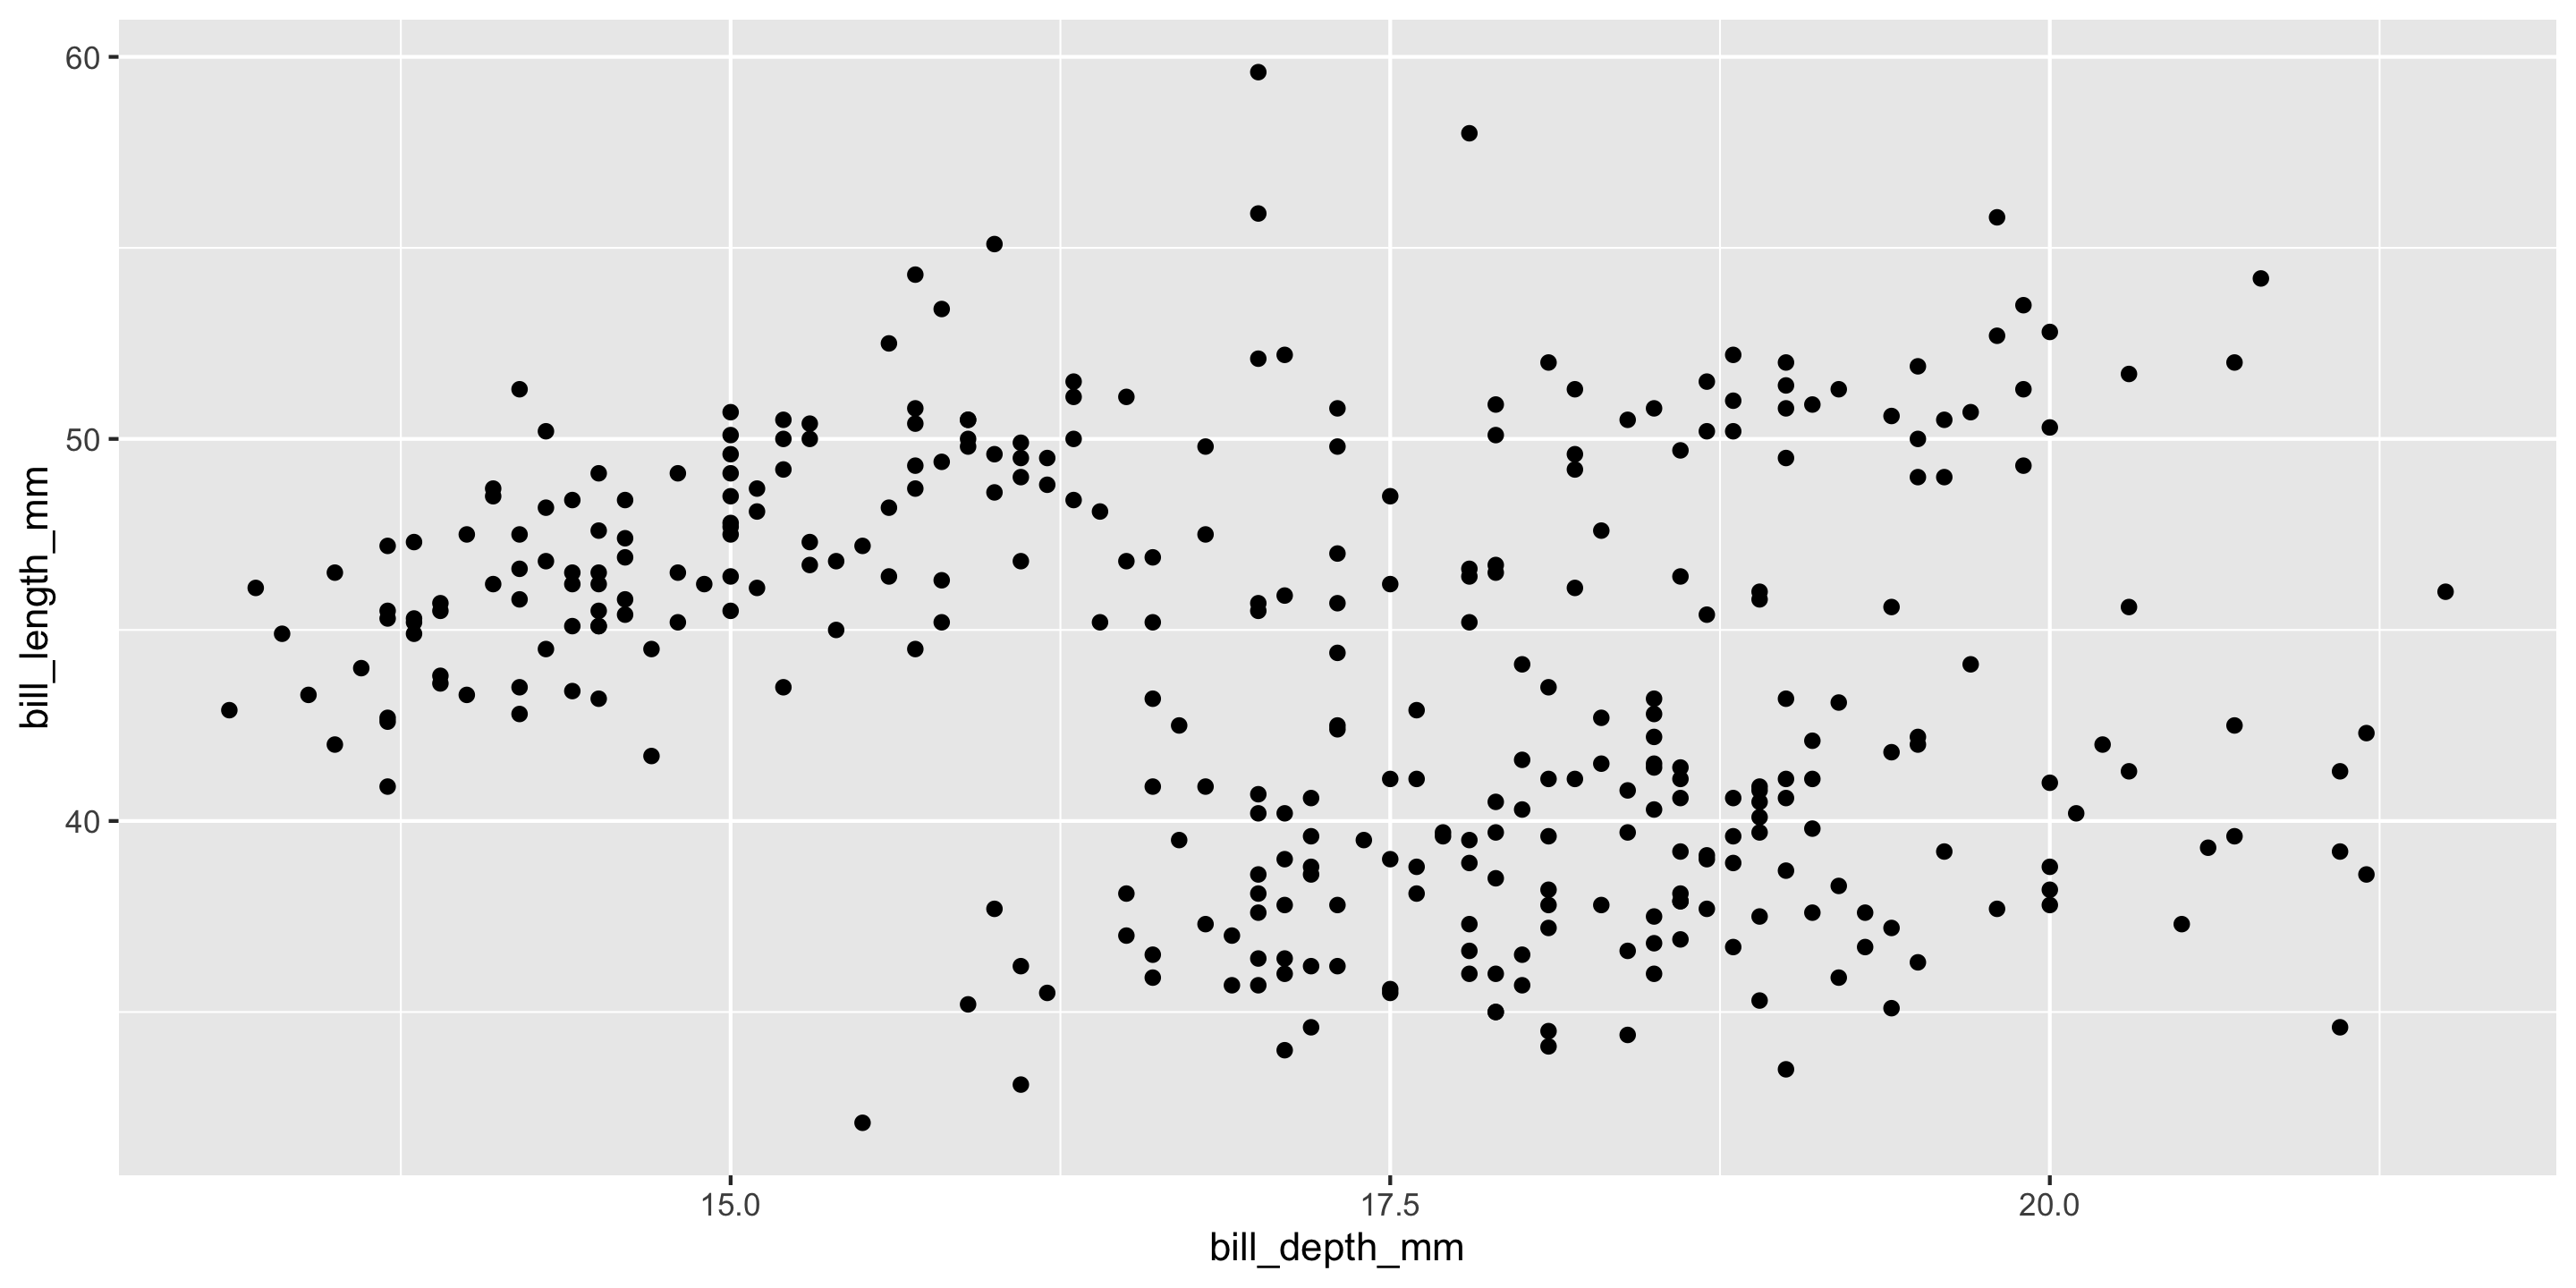
\[ y = \beta_o + \beta_1x_{\textrm{Bill Depth}} + \beta_2 x_{\textrm{Body Mass}} + \epsilon \]
This time: Regression with multiple quantitative predictors
In R:
# A tibble: 3 × 7
  term          estimate std_error statistic p_value lower_ci upper_ci
  <chr>            <dbl>     <dbl>     <dbl>   <dbl>    <dbl>    <dbl>
1 intercept       23.3       3.27       7.14   0       16.9     29.7
2 bill_depth_mm    0.163     0.137      1.19   0.234   -0.106    0.432
3 body_mass_g      0.004     0         12.6    0        0.004    0.005
Visualizing the best fit plane
Least Squares and Prediction
- Still minimizing the sum of squared residuals (from the plane)
- Still predict like usual
Switching gears: handling curved relationships
New data context: movie ratings
Rows: 313
Columns: 16
$ Movie            <chr> "Spider-Man 3", "Transformers", "Pirates of the Carib…
$ LeadStudio       <chr> "Sony", "Paramount", "Disney", "Warner Bros", "Warner…
$ RottenTomatoes   <dbl> 61, 57, 45, 60, 20, 79, 35, 28, 41, 71, 95, 42, 18, 2…
$ AudienceScore    <dbl> 54, 89, 74, 90, 68, 86, 55, 56, 81, 52, 84, 55, 70, 6…
$ Story            <chr> "Metamorphosis", "Monster Force", "Rescue", "Sacrific…
$ Genre            <chr> "Action", "Action", "Action", "Action", "Action", "Ac…
$ TheatersOpenWeek <dbl> 4252, 4011, 4362, 3103, 3778, 3408, 3959, 3619, 2911,…
$ OpeningWeekend   <dbl> 151.1, 70.5, 114.7, 70.9, 49.1, 33.4, 58.0, 45.3, 19.…
$ BOAvgOpenWeekend <dbl> 35540, 17577, 26302, 22844, 12996, 9791, 14663, 12541…
$ DomesticGross    <dbl> 336.53, 319.25, 309.42, 210.61, 140.13, 134.53, 131.9…
$ ForeignGross     <dbl> 554.34, 390.46, 654.00, 245.45, 117.90, 249.00, 157.1…
$ WorldGross       <dbl> 890.87, 709.71, 963.42, 456.07, 258.02, 383.53, 289.0…
$ Budget           <dbl> 258.0, 150.0, 300.0, 65.0, 140.0, 110.0, 130.0, 110.0…
$ Profitability    <dbl> 345.30, 473.14, 321.14, 701.64, 184.30, 348.66, 222.3…
$ OpenProfit       <dbl> 58.57, 47.00, 38.23, 109.08, 35.07, 30.36, 44.62, 41.…
$ Year             <dbl> 2007, 2007, 2007, 2007, 2007, 2007, 2007, 2007, 2007,…
Response variable:
Explanatory variables:
Exploring the Data
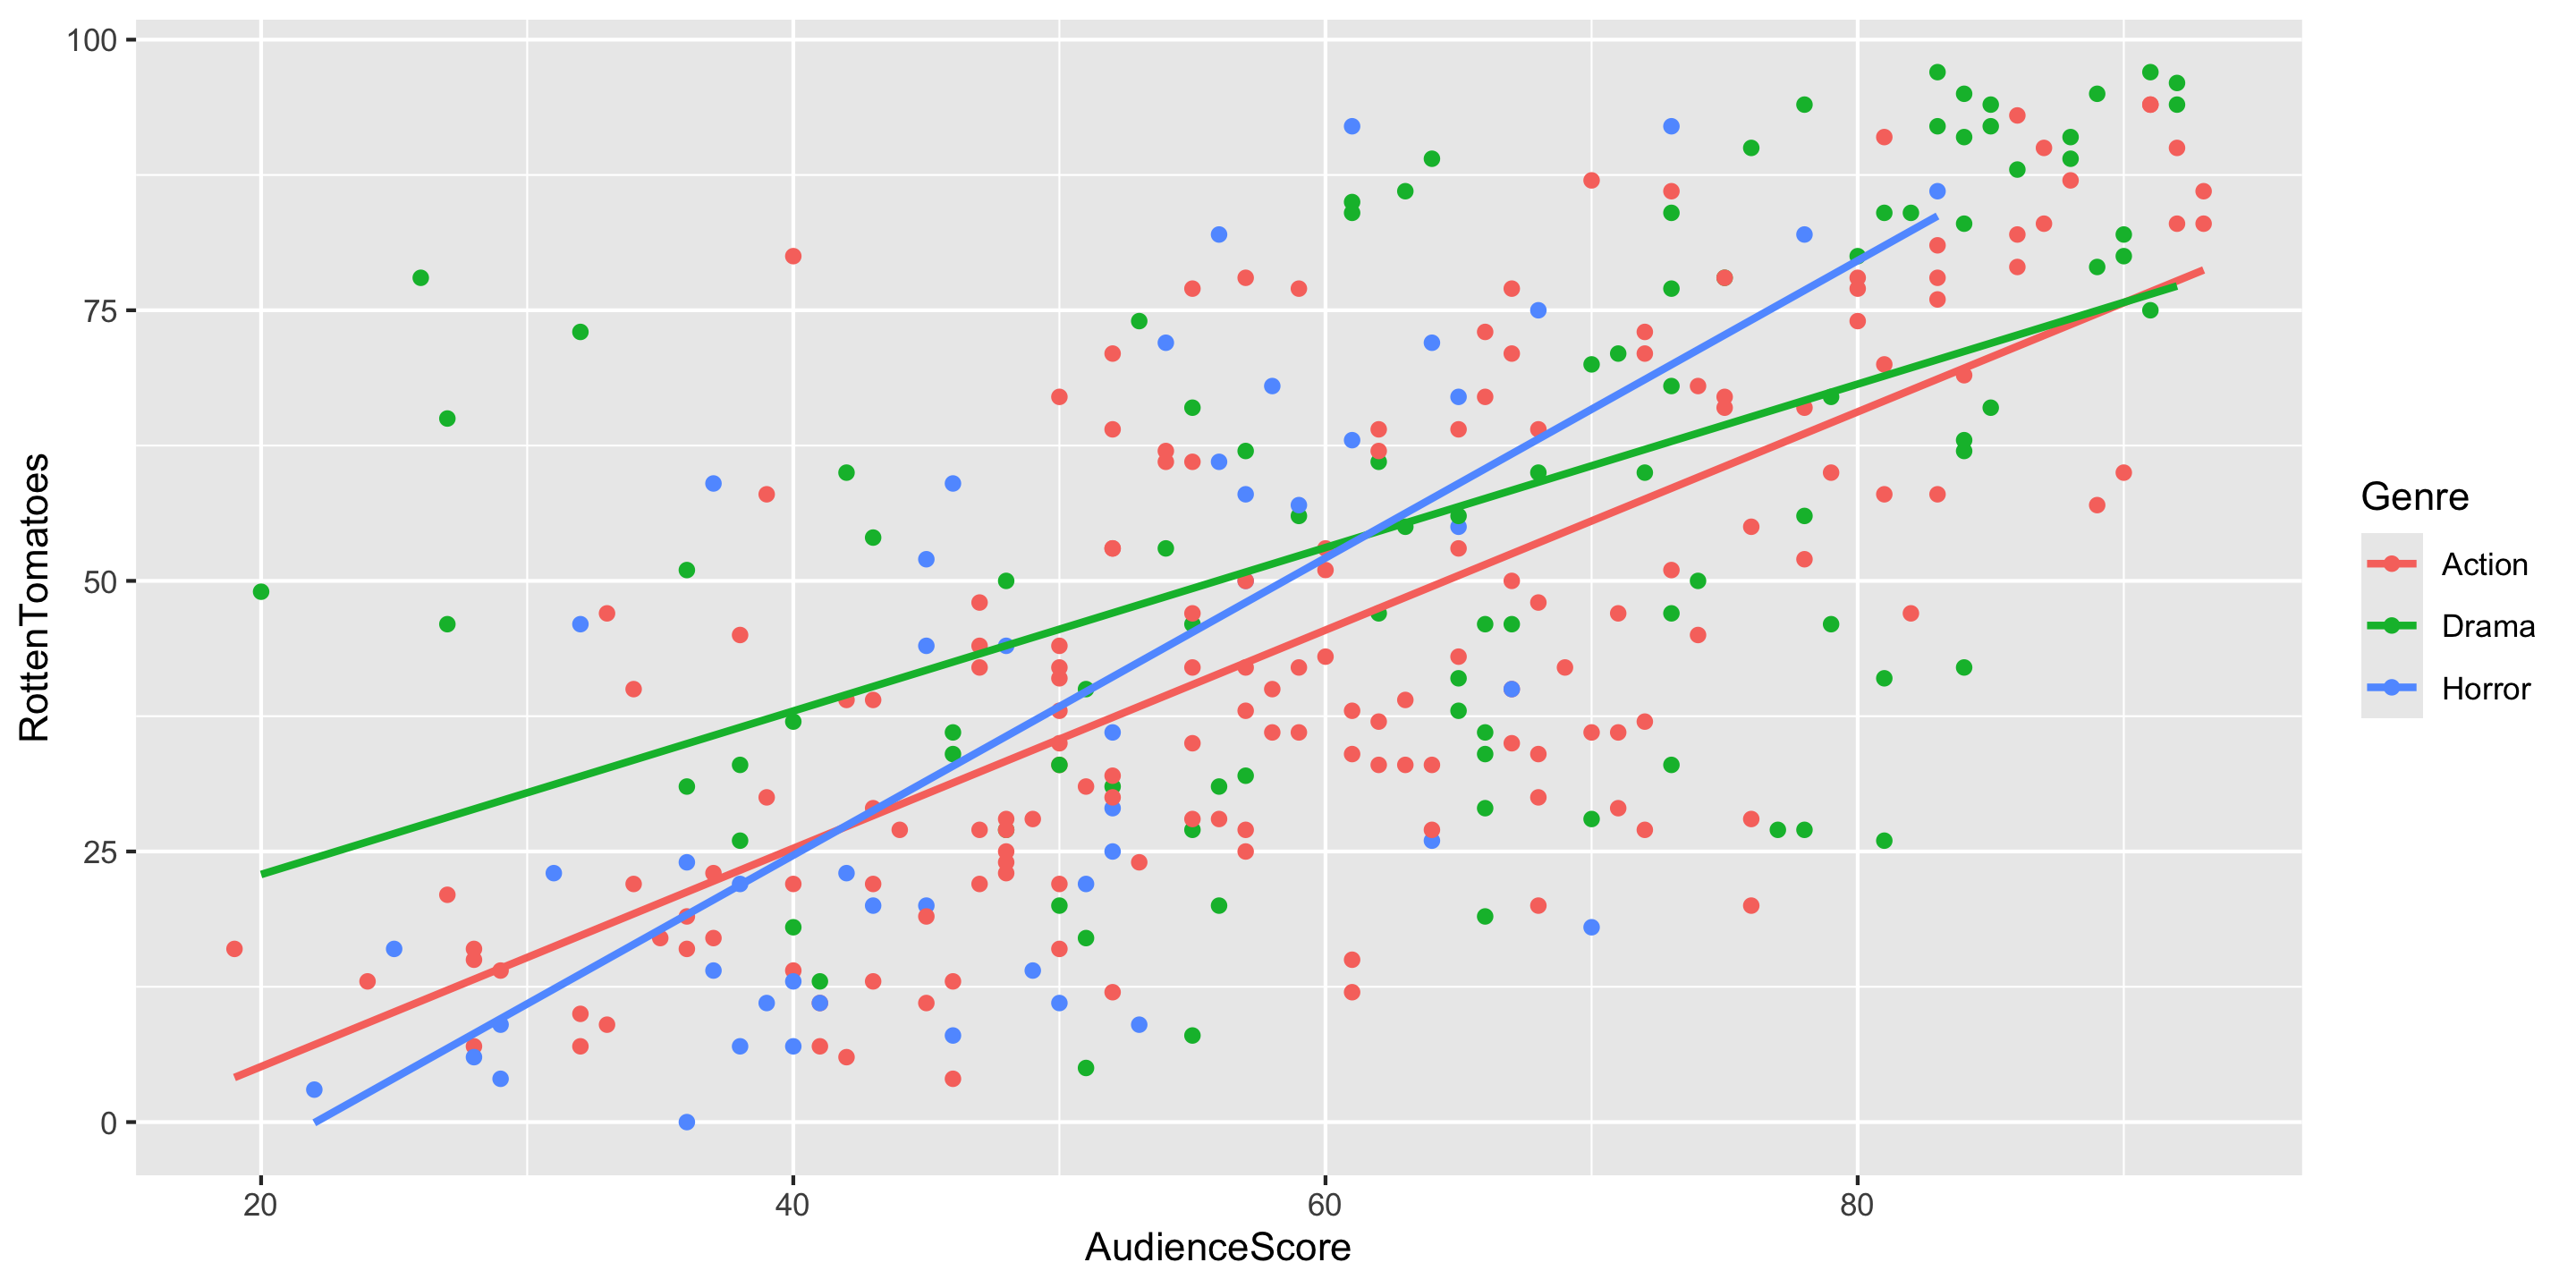
Trends?
Should we include interaction terms in the model?
Building the Model:
Full model form:
# A tibble: 6 × 7
  term                    estimate std_error statistic p_value lower_ci upper_ci
  <chr>                      <dbl>     <dbl>     <dbl>   <dbl>    <dbl>    <dbl>
1 intercept                -15.0       5.27      -2.85   0.005  -25.4     -4.67
2 AudienceScore              1.01      0.085     11.8    0        0.84     1.18
3 Genre: Drama              22.8       8.94       2.55   0.011    5.23    40.4
4 Genre: Horror            -15.2      11.0       -1.39   0.165  -36.8      6.32
5 AudienceScore:GenreDra…   -0.253     0.136     -1.86   0.065   -0.522    0.015
6 AudienceScore:GenreHor…    0.365     0.206      1.77   0.078   -0.04     0.771
Estimated model for Dramas:
Our current model
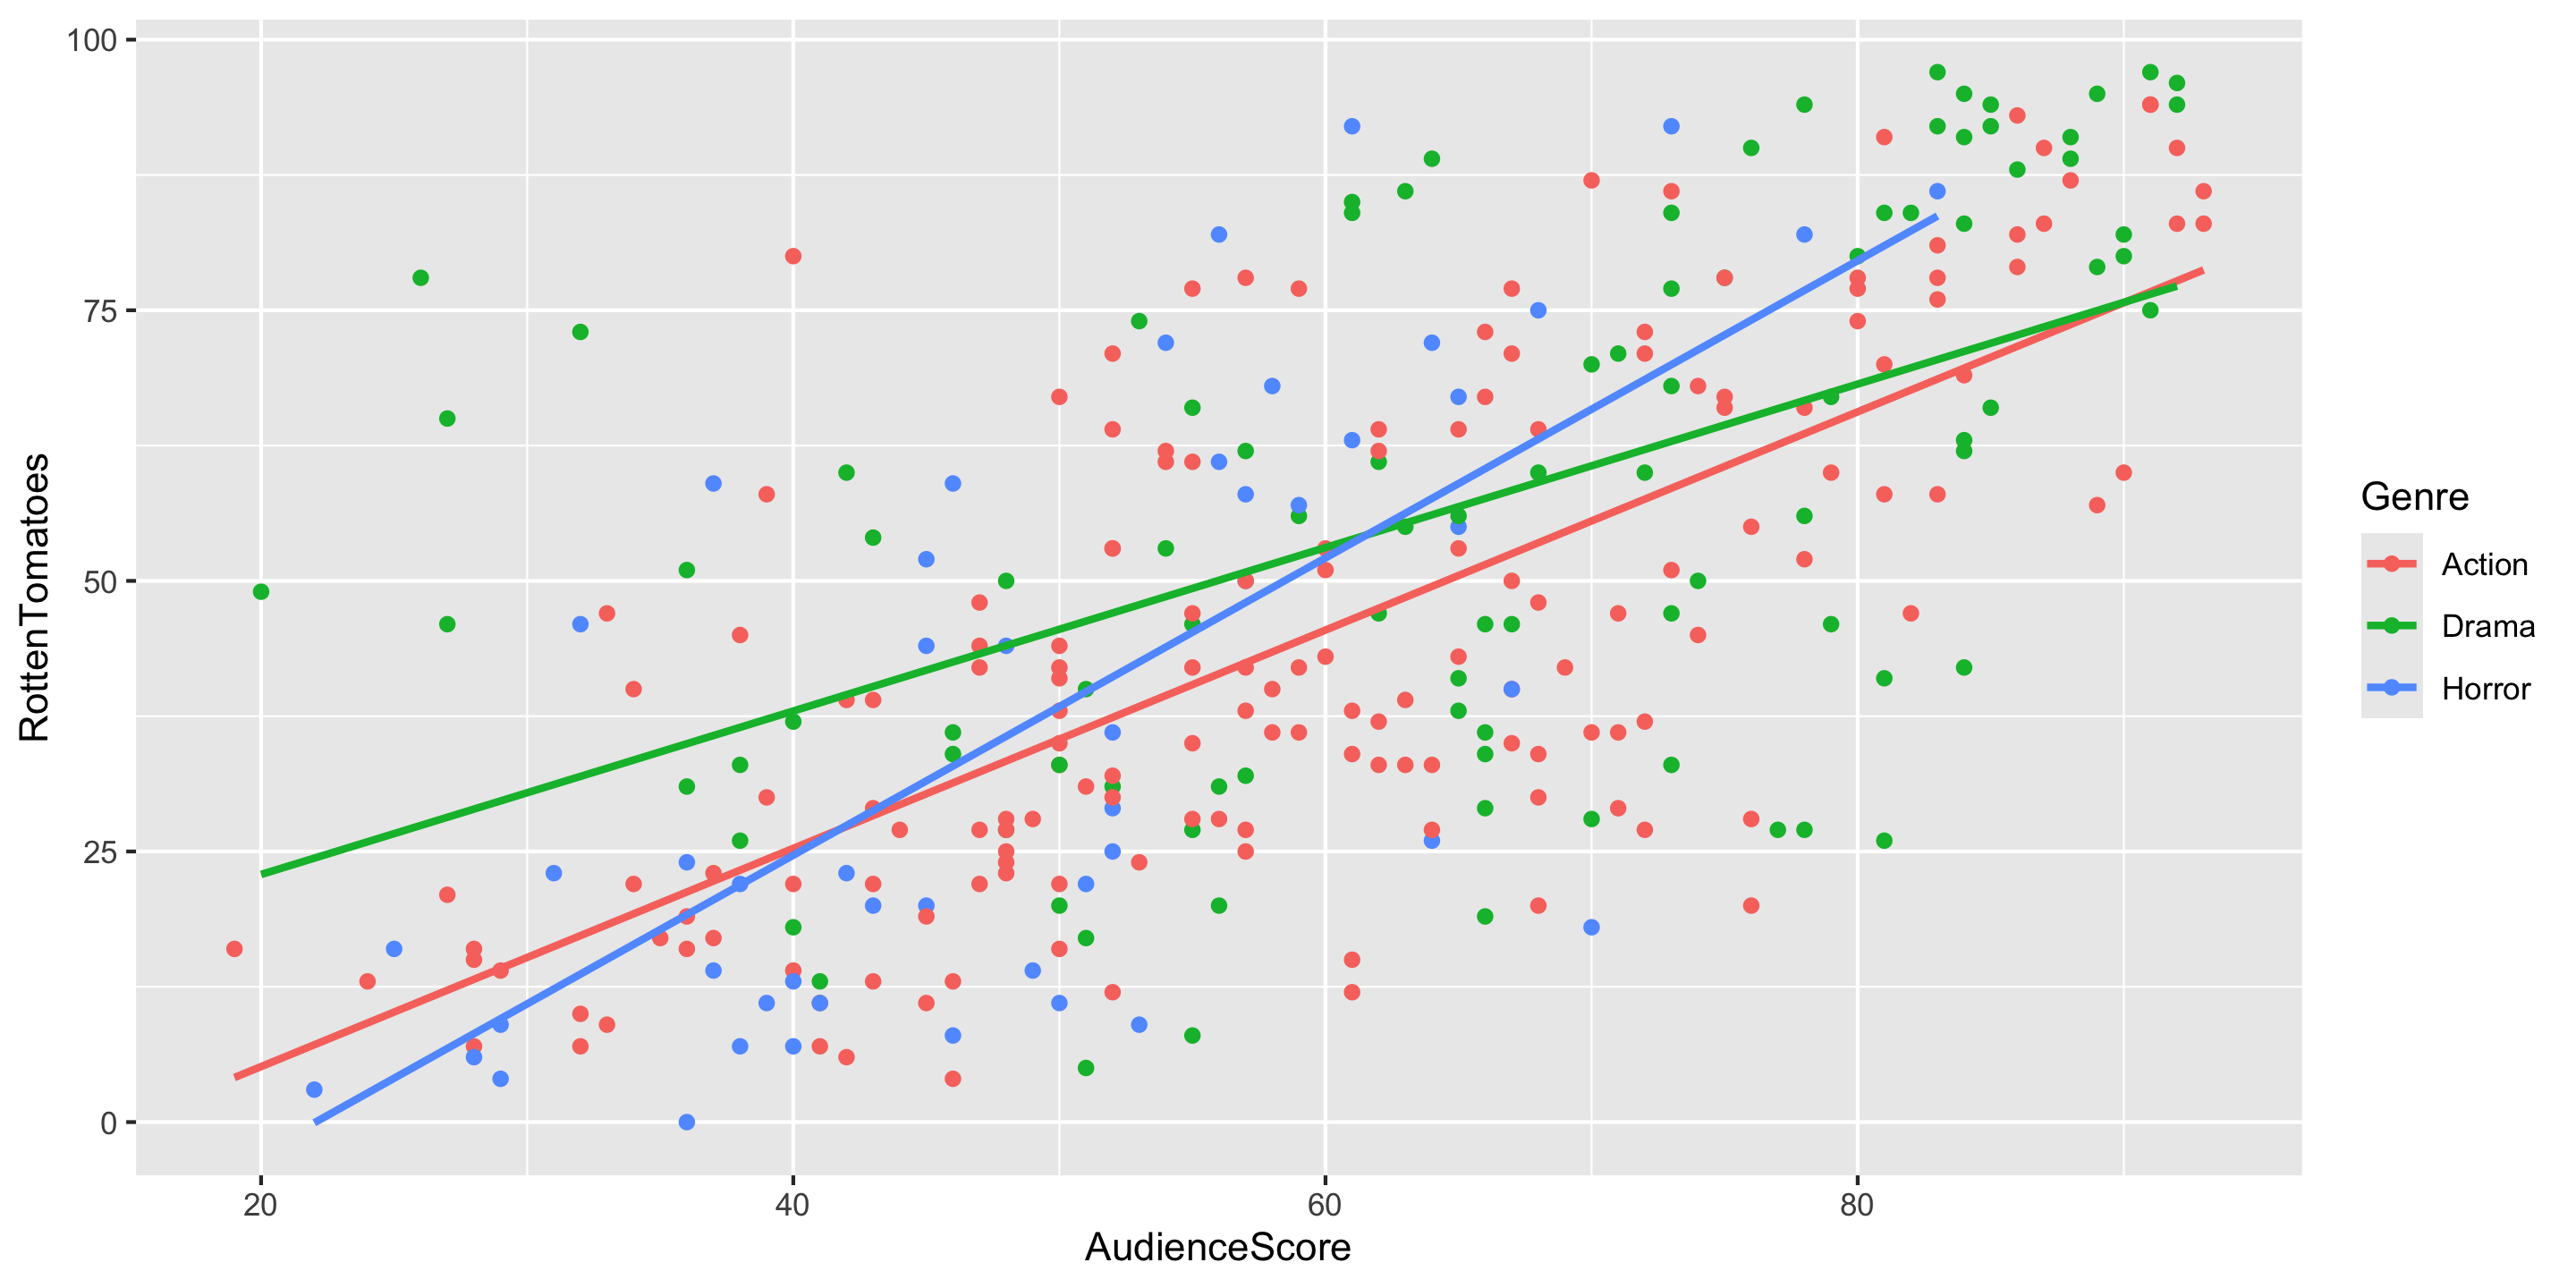
Adding a Curve to your Scatterplot
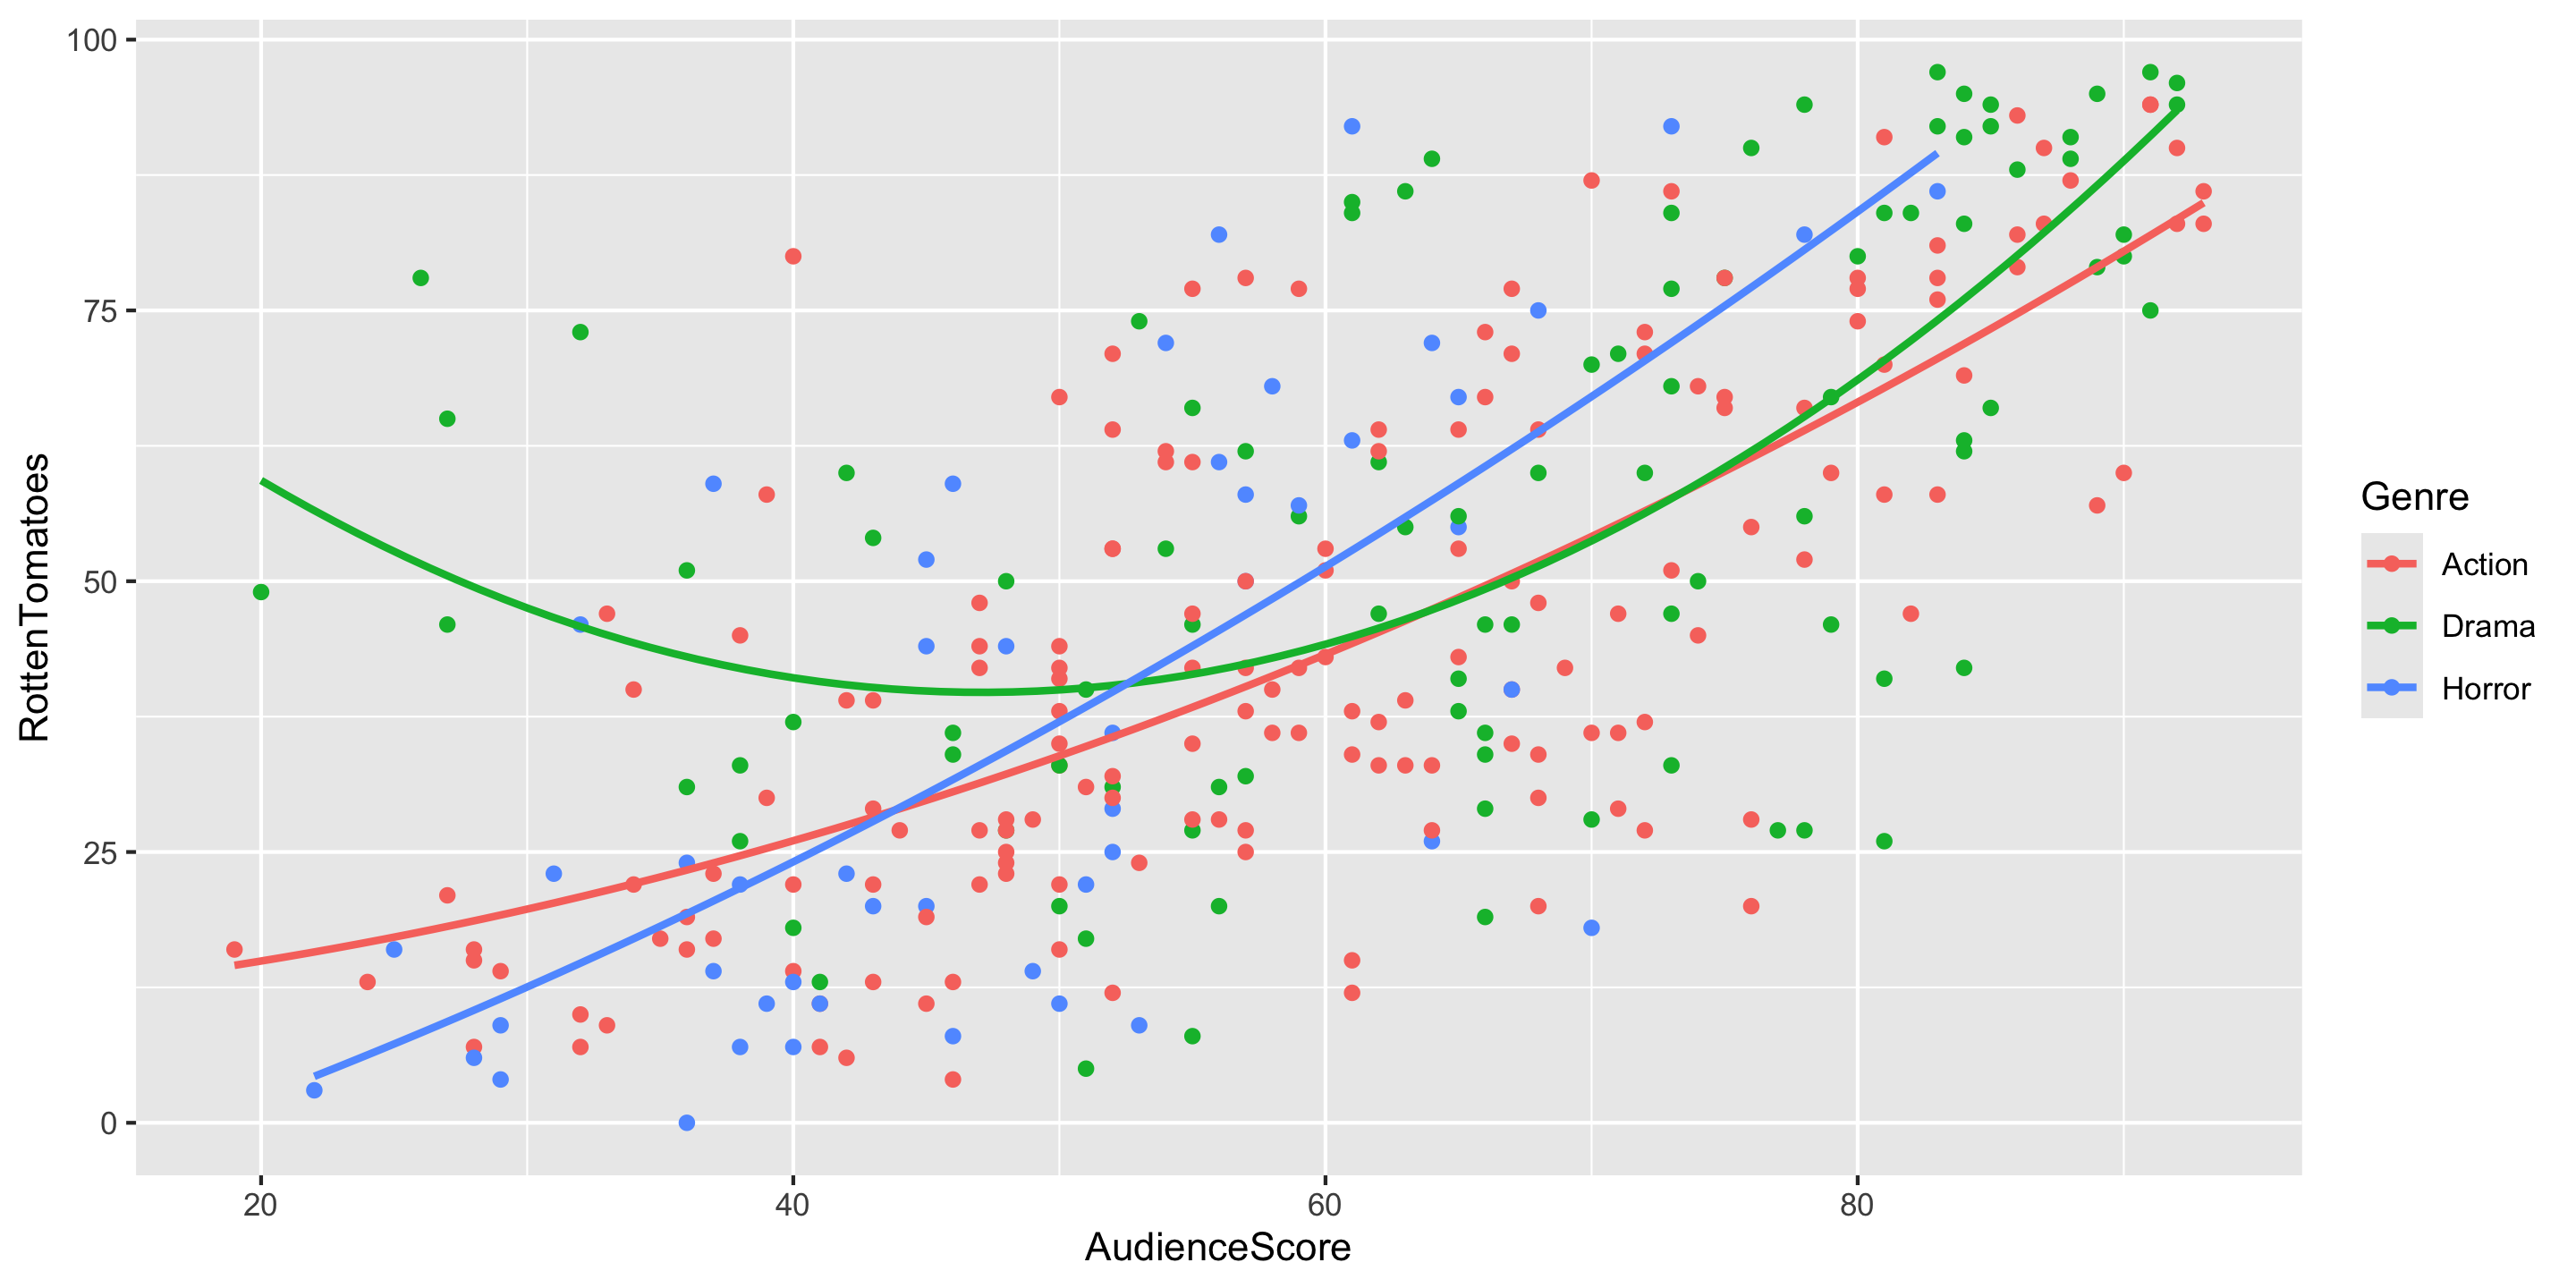
Fitting the New Model
# A tibble: 9 × 7
  term                    estimate std_error statistic p_value lower_ci upper_ci
  <chr>                      <dbl>     <dbl>     <dbl>   <dbl>    <dbl>    <dbl>
1 intercept                  9.92     14.9       0.668   0.505  -19.3     39.1
2 poly(AudienceScore, de…    0.098     0.515     0.191   0.849   -0.916    1.11
3 poly(AudienceScore, de…    0.008     0.004     1.79    0.075   -0.001    0.016
4 Genre: Drama              88.9      24.5       3.62    0       40.6    137.
5 Genre: Horror            -23.8      31.1      -0.765   0.445  -84.9     37.3
6 poly(AudienceScore, de…   -2.61      0.84     -3.11    0.002   -4.26    -0.956
7 poly(AudienceScore, de…    0.019     0.007     2.78    0.006    0.006    0.032
8 poly(AudienceScore, de…    0.574     1.22      0.469   0.639   -1.83     2.98
9 poly(AudienceScore, de…   -0.001     0.012    -0.061   0.951   -0.024    0.022
Linear Regression & Curved Relationships
Form of the Model:
\[ \begin{align} y &= \beta_o + \beta_1 x_1 + \beta_2 x_2 + \cdots + \beta_p x_p + \epsilon \end{align} \]
But why is it called linear regression if the model also handles for curved relationship??
Lab 2
Next week
- Resampling methods